

After getting back from KubeCon + CloudNativeCon North America 2025 in Atlanta (always a great event for catching up on what’s next in cloud native). I was lucky enough to spend time with the team at ControlTheory while I was there as part of our media coverage for the event.
They were showing off their take on using AI for log analysis, with a focus on pulling “sentiment” out of logs as an extra signal. It’s an idea I’ve pondered before (logs often have that human touch in how errors or warnings are phrased), so I stopped by for a demo of Gonzo and Dstl8. Here’s what stood out to me, from a practical ops perspective.
The Ongoing Challenge of Log Volume
We’ve all been there: during an incident, you’re drowning in logs from multiple pods and services. Errors mix with warnings and info messages (it quickly turns into noise). Traditional setups rely on dashboards, alerts, and grep-style searches, which work but can take time.
As much as the industry talked about a “race to zero” on the cost of cloud storage, it’s far from the case for any enterprise platform builder. The cost of observability and log storage is surprisingly high, and grudgingly being paid because it feels like there is no alternative.
The ControlTheory demo highlighted one angle I hadn’t seen emphasized much: treating sentiment in logs as a useful indicator. Things like repeated retry messages or increasingly urgent warnings can signal building problems before they explode. It’s not a replacement for metrics or traces, but an additional layer on top of what we’re already collecting.
What I See in Gonzo and Dstl8
ControlTheory builds on control theory concepts (feedback loops for stability) applied to observability.
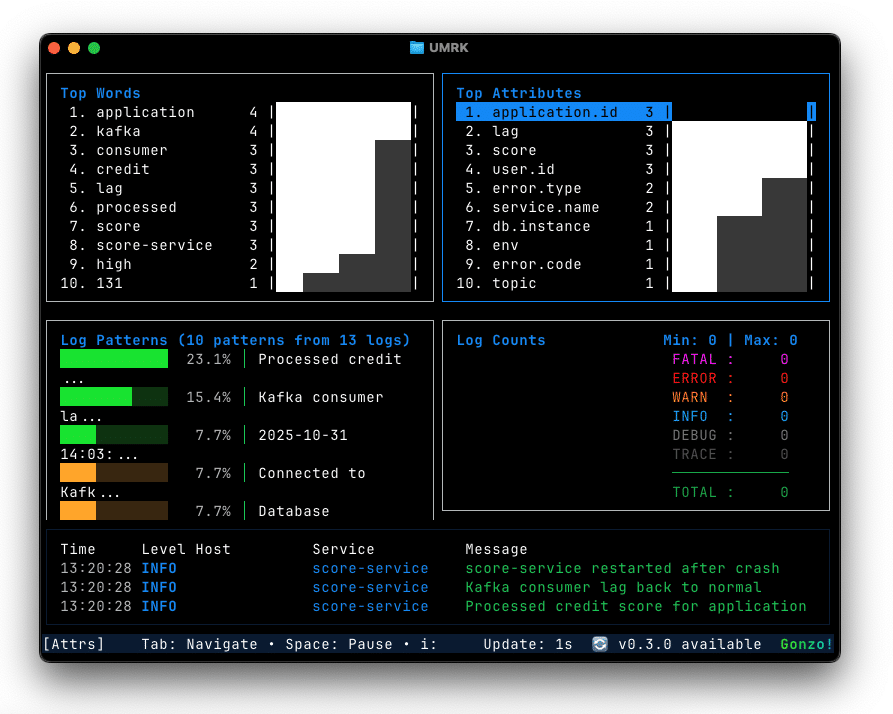
Gonzo is their open-source terminal-based UI for logs. If you’re someone who lives in the terminal (like me for debugging Kubernetes or other setups), it fits right in. It pulls logs natively from K8s, supports real-time streaming, and includes features like pattern detection. During the demo, it was straightforward to jump in and see groupings without leaving the command line. It’s available on GitHub and has picked up a decent number of stars quickly.

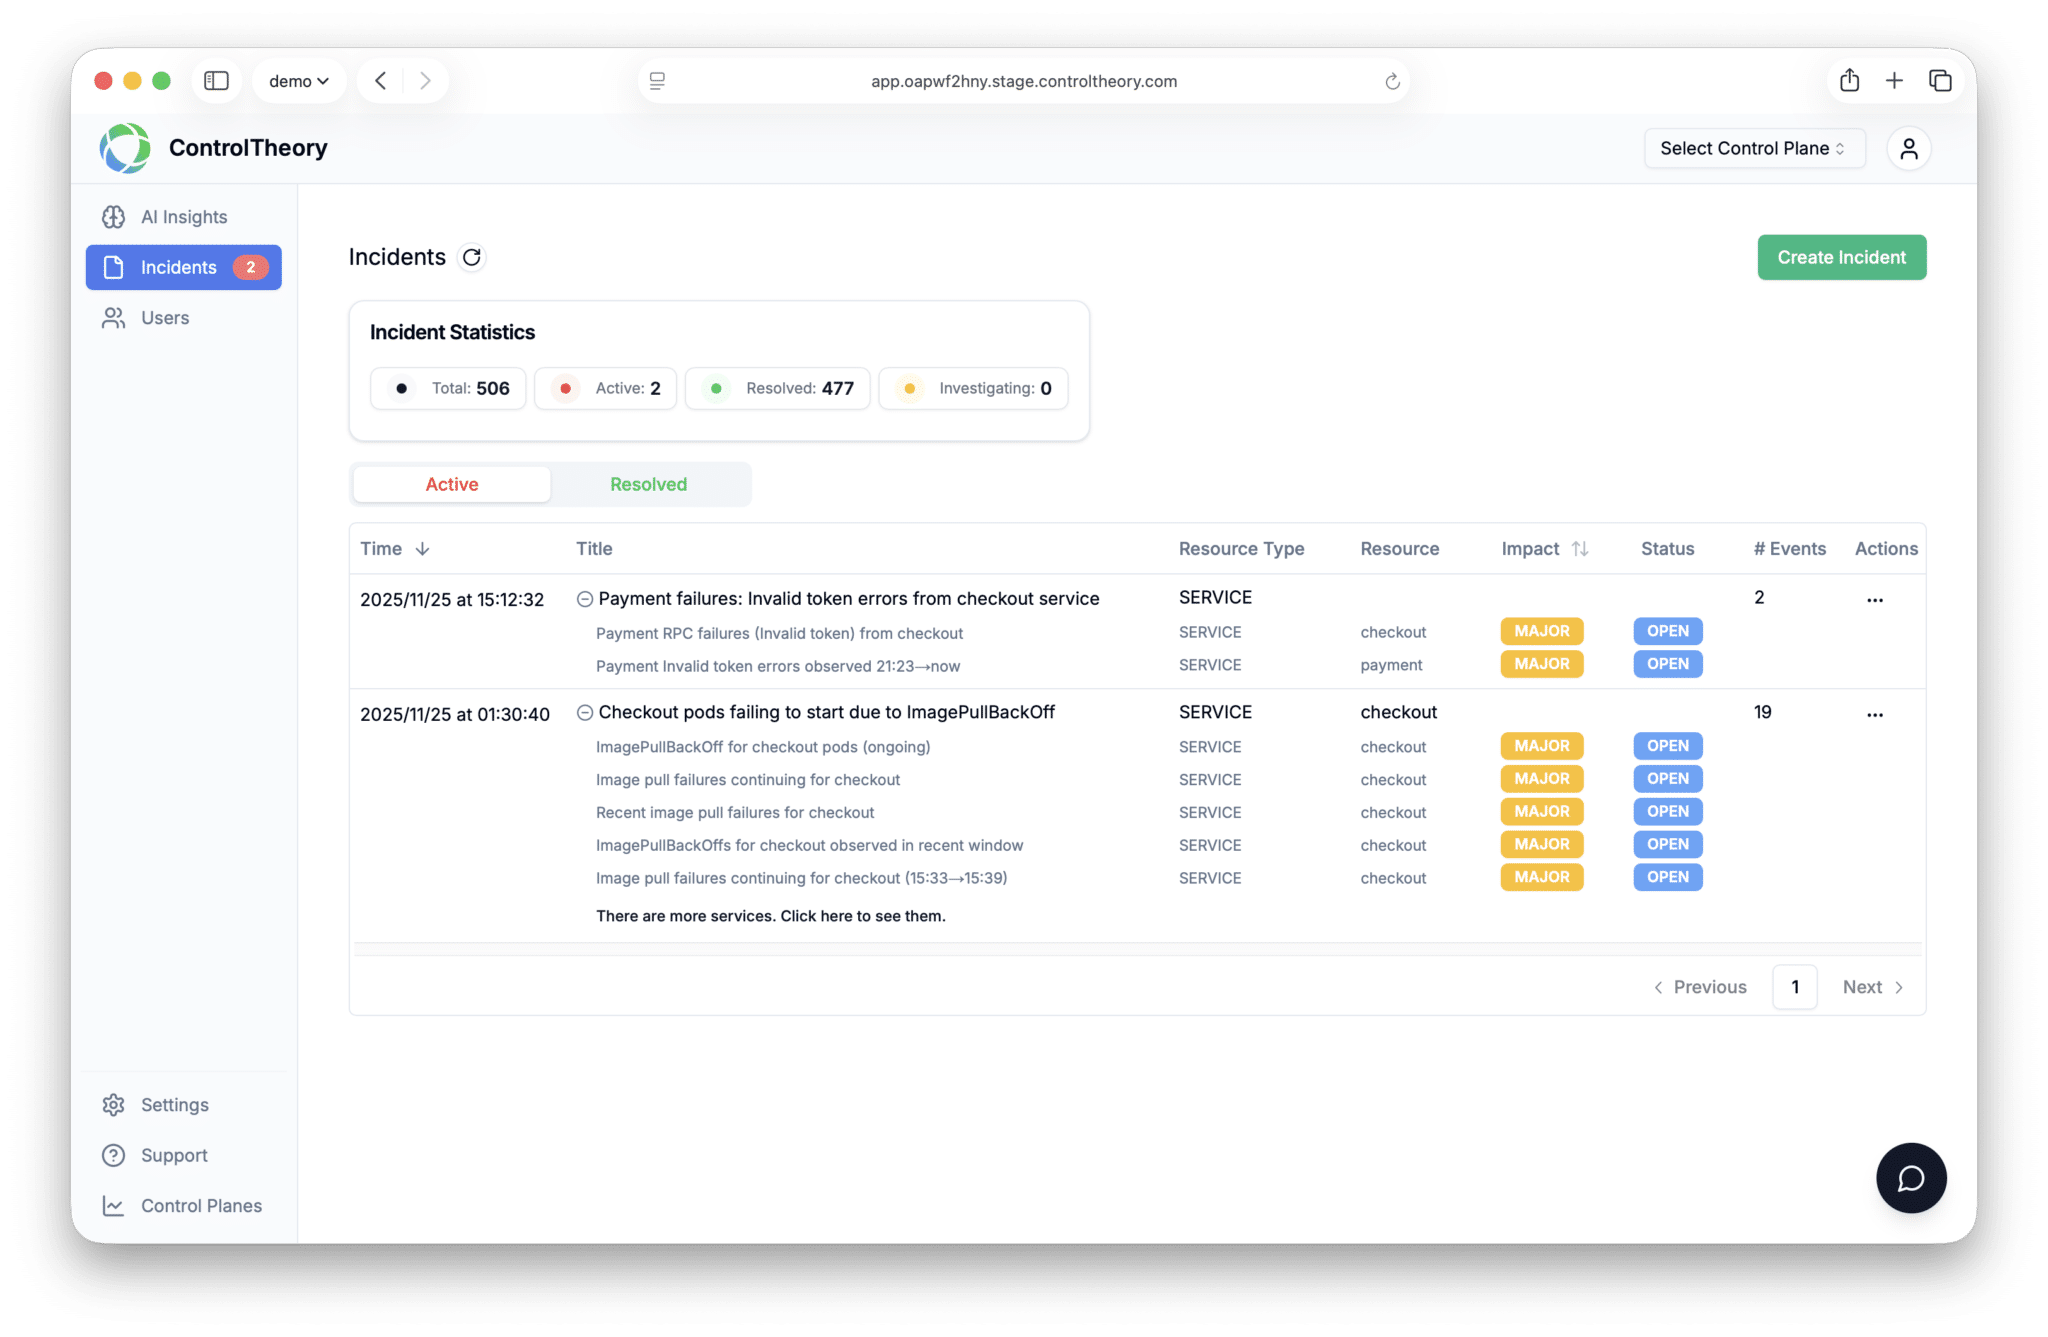
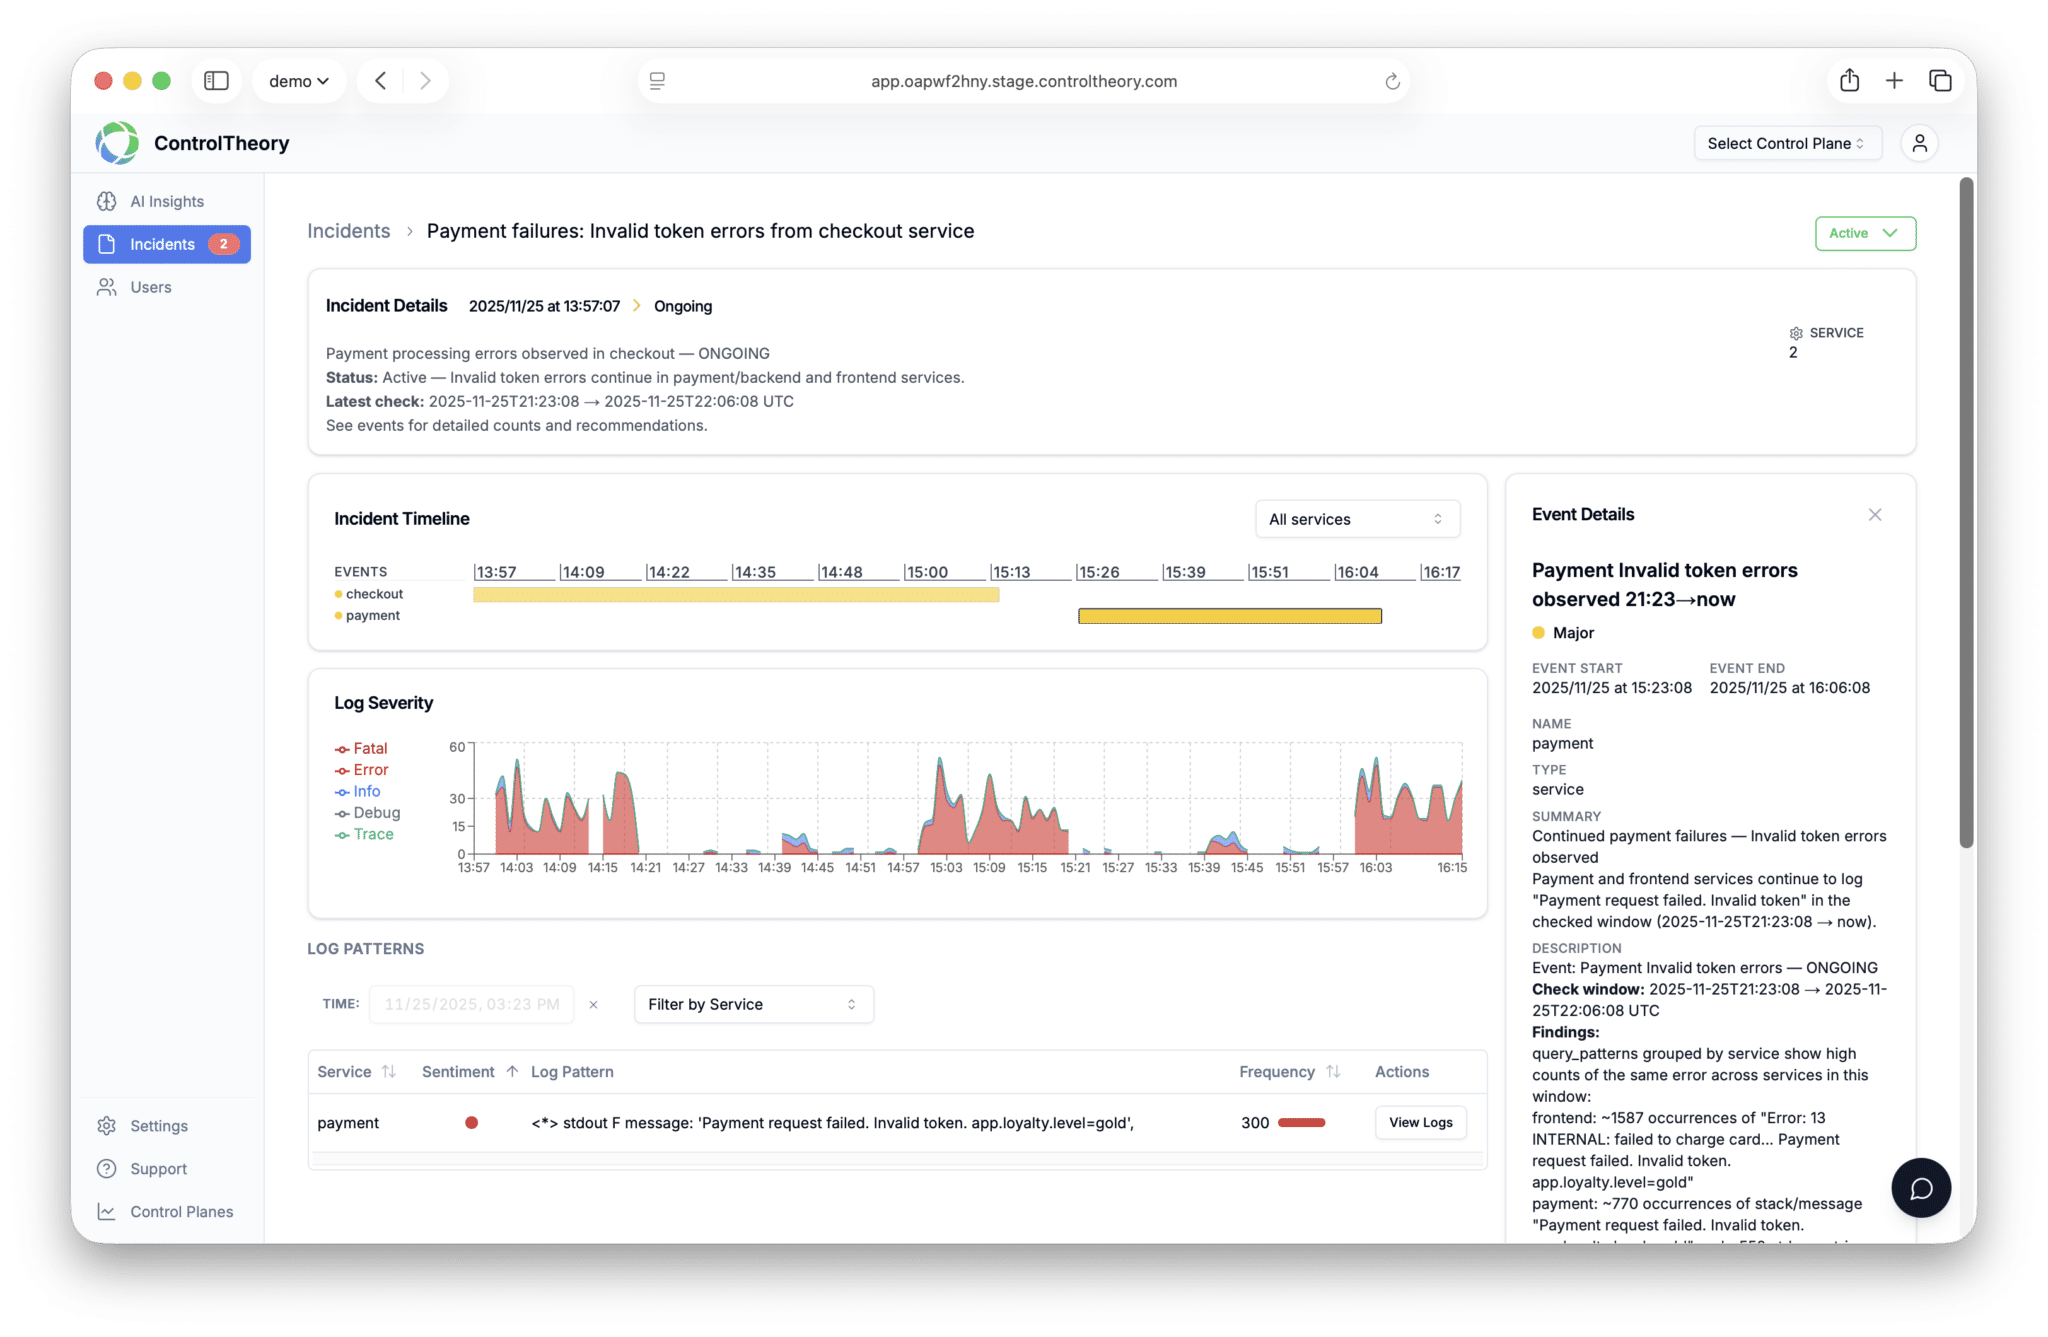
Dstl8 is the broader platform, using their Möbius AI for ongoing analysis. It processes logs at the edge, summarizing and highlighting things like sentiment trends or severity shifts. In the demo, it generated natural-language explanations for simulated issues (for example, linking a config problem to a retry loop and latency spikes). The edge focus means less data sent upstream, which could help with costs.

Both support OpenTelemetry, which is a plus for existing stacks.
Thoughts from the Demo and Floor Conversations
The idea of sentiment as a signal makes sense on paper (logs often reflect “frustration” in patterns, like escalating errors). It’s interesting to see it applied systematically. I’ve explored a bunch of use-cases myself that I have for Gonzo and it was interesting to validate some of my assumptions with others around the expo.
Talking to others at the booth and around the floor, folks were curious about integration effort. Starting with Gonzo was seen as extremely low-risk since it’s open source and doesn’t interrupt your application flow. Just add in the stages you need insights, whether that is local development, release monitoring, or even streaming prod logs back to your dev workstation.
I actually use it for monitoring my Ruby on Rails dev work as I work locally, and also to stream my Heroku logs to make sure my builds go cleanly, or find out why issues may be occurring with out having to sift through all the logs myself.

For Dstl8, privacy and model auditing came up (good that it supports edge processing). Overall, it fits into the bigger KubeCon themes around AI assisting ops without adding more complexity.
The detail level in the way Dstl8 describes the incidents and events inside logs is in exactly the natural language I need to treat it like a co-worker, not a tool.
Final Reflections from ControlTheory at KubeCon
This demo got me thinking again about how much untapped info sits in our logs. Tools like these could help surface it faster, potentially cutting down debug time. I’m planning to try Gonzo on some personal projects to see how it feels in real workflows.
Logs have feelings too! It’s time to get more out of your logs. This cuts down on the need for doing advanced instrumentation, and every application or infra tool in the world ships logs. This seems to be a no-brainer for people to try it out.
Let me know what you think!